

How To Detect LCP Elements On Your Website
We can’t discuss fixing web vitals without discussing one key factor called LCP, the Largest Contentful Paint. LCP is essential to the user experience. People typically don’t like to wait for a page to start loading when they could immediately get a faster experience elsewhere.
LCP tells you how long it takes to load the main contents of your page and become readable to the users. The faster the LCP is, the better-performance impression a user gets on your website.
The largest Contentful Paint is considered one of the main factors on the web vital and starting to play a vital role in your page rank on the SERPs. To be in favor of Google and have pages that deliver a better experience for the visitors, it’s important to remain on top of your LCP.
Poor LCP can be one of the reasons for higher bounce rates, ranking issues, or even lower conversion rates.
What is a Good Or Bad LCP?
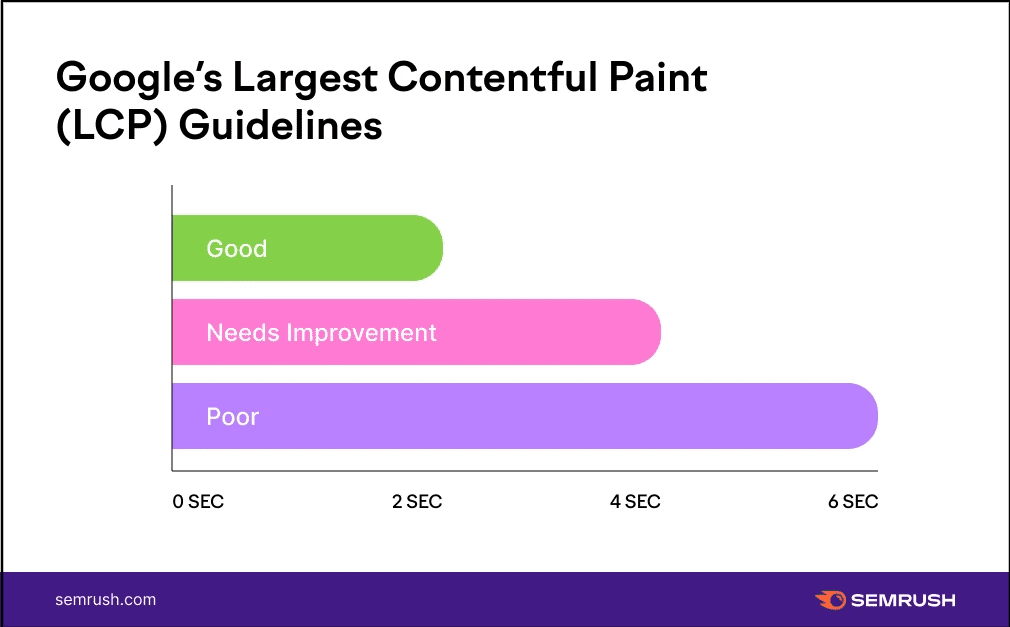
According to Google, the main content of a page should load within 2.5 seconds when a user tries to visit a page, which refers to having a good LCP. If the main content takes more than 5 seconds, people are likely to exit from your site and be considered poor LCP.
Usually, when a page can maintain a good LCP (main content load time under 2.5 seconds) for 75% of the time, the performance is considered good in Google Search Console.
This image explains how LCP ratings are categorized.
What can cause poor LCP and how to detect it?
There’s not a definite element that is responsible for LCP. Anything that slows down the page rendering process could be the reason for the LCP issue on your pages. Usually, the elements that take up a lot of space, media players, unoptimized images, social media buttons with 3rd party connections, and newsletter sign-up forms can increase your page’s load time.
If we dive deeper to find the primary reasons for LCP, they can be classified this way.
1. Slow Server Response Times
Regardless of how much you try to optimize your website, if you have a slow server, its response time will slow down your page loading matrices. This will definitely result in a poor LCP record.
Bad server back-end infrastructure, unoptimized databases, and longer time to resolve API requests are often the reasons for slow server response time.
So the first step towards improving your LCP records is to host your website on a fast web server.
2. Slow Resource Load Times
Resources that are large in file size or have a dense visual impact will take longer to load. Unoptimized images, GIF files, videos, and many text content above the fold will affect your LCP record.
The best way to take care of your LCP is to compress file size, ensure loading only necessary elements above the fold, and avoid video or large image files in the first print.
3. Render blocking Javascript and CSS
CSS and Javascript play a significant role in how they are being served. Adding javascript and CSS to make a fancy-looking web page will eventually cost your page performance.
It’s true that without CSS and javascript codes, we can’t add dynamic, interactive, and attractive elements to our websites. But the timing of execution for these files should be taken care of. If you load them in head and they take longer execution time, it will block other website assets from loading.
Reducing render-blocking assets can significantly boost your pages in terms of LCP. Still, you must remember while fixing render-blocking, you are not shifting important libraries and javascript & CSS codes to the footer. This might end up with a broken web page or an accessibility issue.
4. Client-side Rendering
Rendering web pages in the browser with JavaScript is a popular web development method. Client-side rendering can be one of the main reasons for LCP issues if your pages use this method.
Client-side rendering involves the browser collecting and loading javascript before rendering primary content on the page. The webpage might struggle to pass LCP matrices depending on the rendering time and complexity.
So when you are concerned about your LCP and have client-side rendering on your site, consider optimizing or avoiding client-side rendering if possible.
How to discover LCP elements on your page?
To fix LCP issues, you need to know what your LCP is. I have ordered the steps we follow to analyze the LCP of a web page and have the plan to take necessary action to fix it.
1. Use Google Search Console
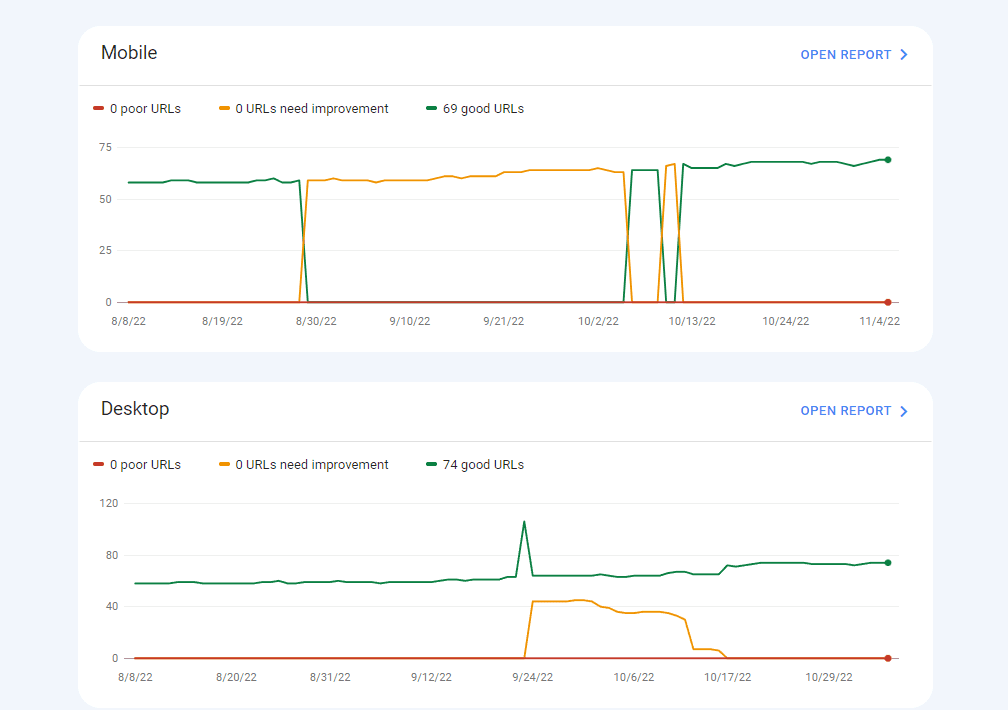
A good way to confirm your page has LCP issues is by checking Google Search Console’s web vital section. The web vital section displays URL’s performance status collected across real users’ devices. You will have a unique report for desktop and mobile versions.
When the URLs are good, your site LCP has to be good. But when they are marked as “need improvement” or “poor,” you might need to check which web vital metrics are actually flailing & need rechecking.
2. Use page speed insight
Page speed insight is a dedicated tool to instantly check the web vitals of a page over the latest 28-day collection period and via live test. When the origin data in page speed insight has an LCP of less than 2.5 seconds means it’s in a safe range.
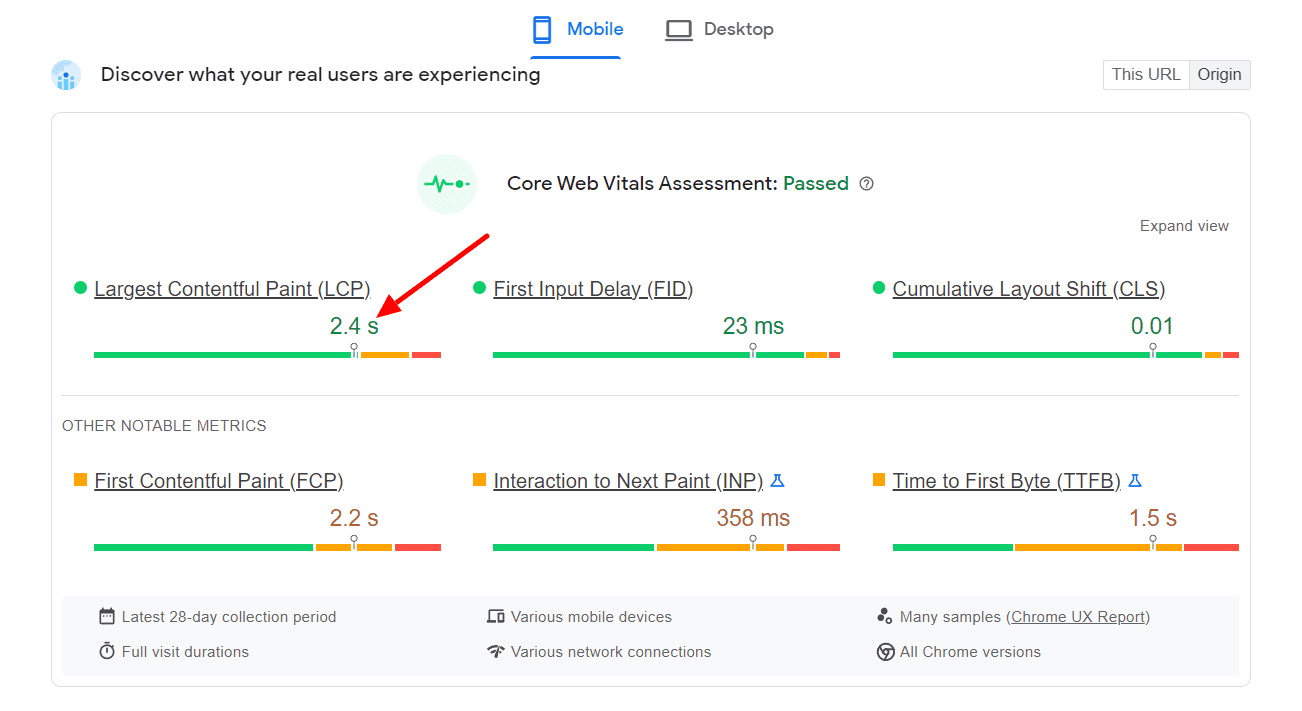
It’s the more than 2.5 sec LCP when you should be concerned and try to fix it. The instant test of Page Speed Insight should help you identify elements that are responsible for LCP.
Steps –
- Go to page speed insight
- Perform a test on your page.
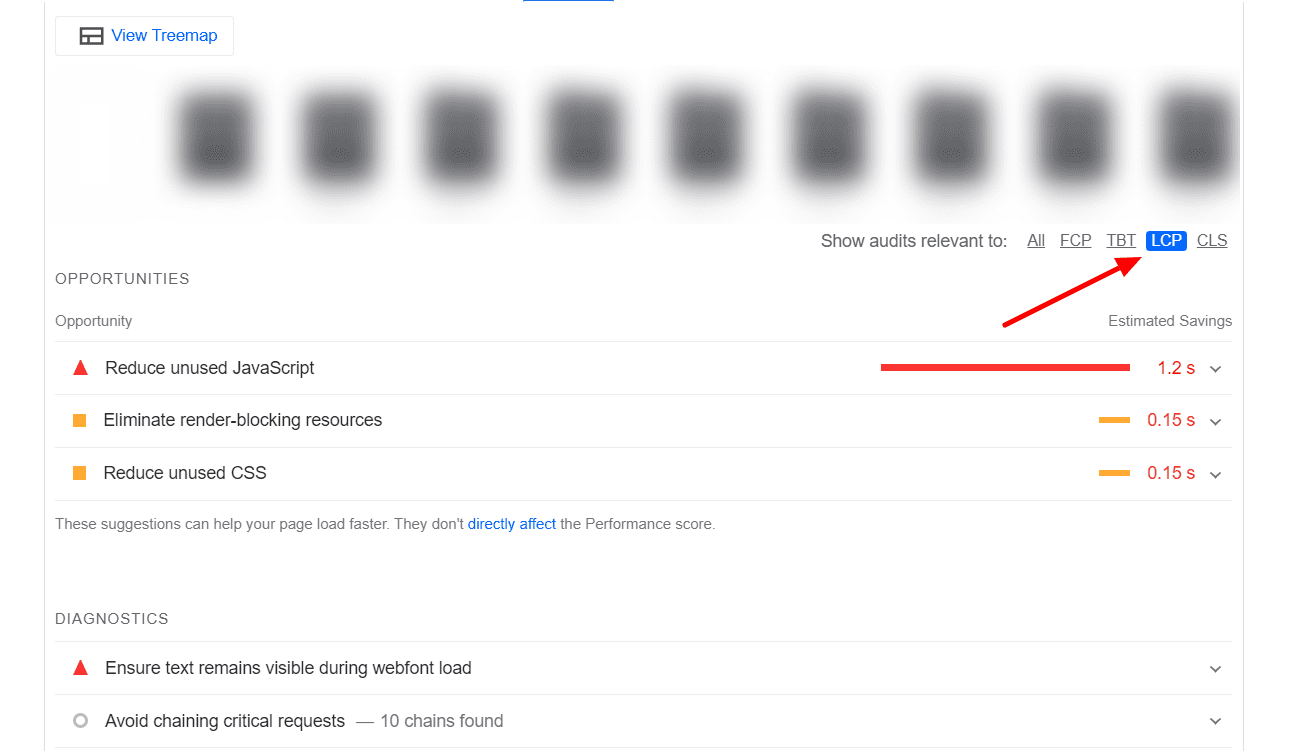
- Scroll down to the “Diagnose performance issues” section.
- Then set the “Show audits relevant to” to LCP.
- You will be displayed the opportunity to improve LCP and diagnostics.
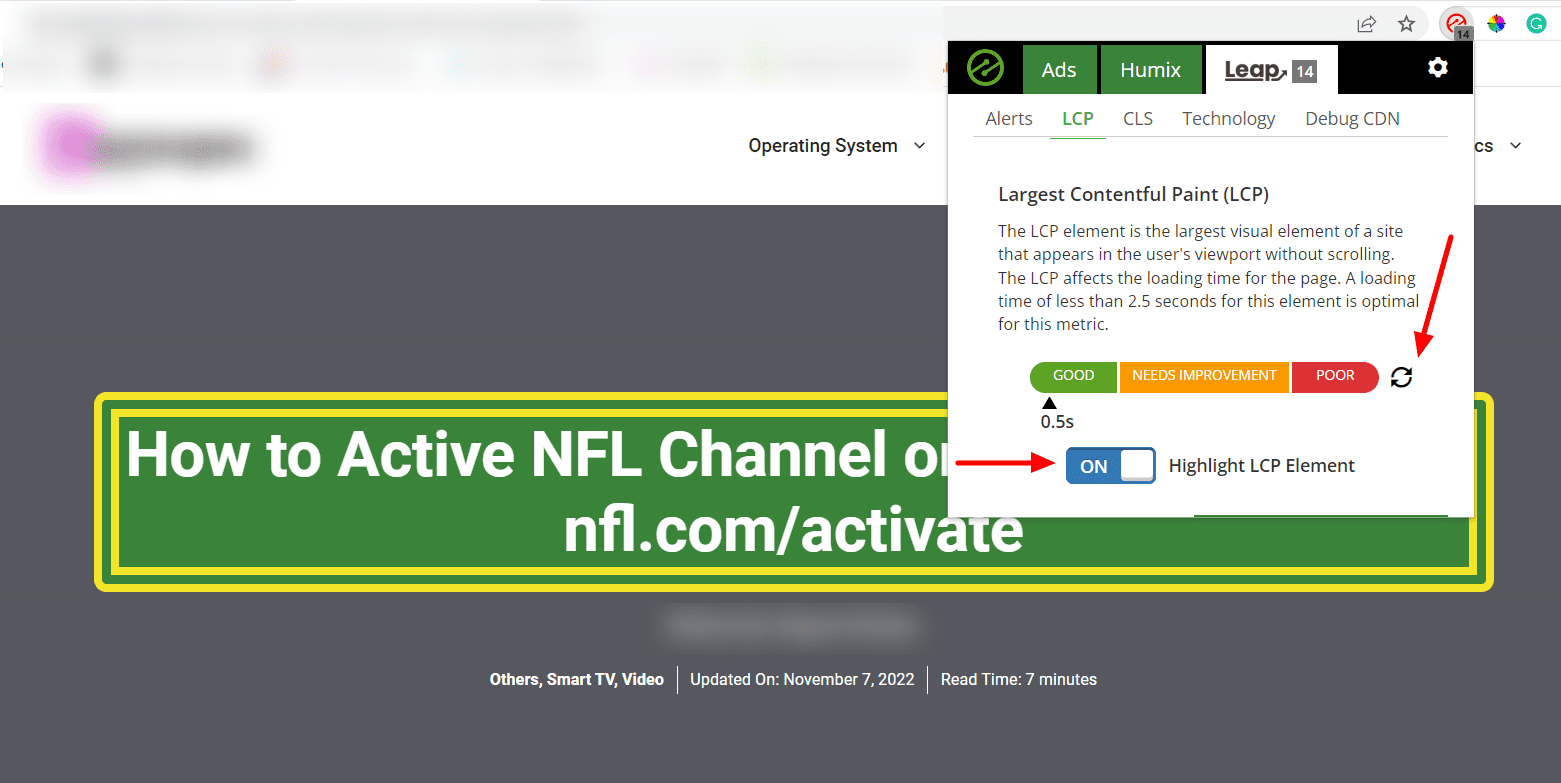
3. Use Ezoic’s Browser Extension
Another easy way to inspect your LCP elements is via the browser extension by Ezoic. Usually, this extension is useful for creating ad and video placeholders on your pages. You can adjust those placeholders and test different configurations to boost Ezoic revenue.
There is another section called LEAP where you can perform performance-related alerts, debug CDN on a page, analyze the LCP and highlight LCP elements. After analyzing a page, make sure to toggle the “Highlight LCP element” for the plugin to highlight the LCP element in yellow.
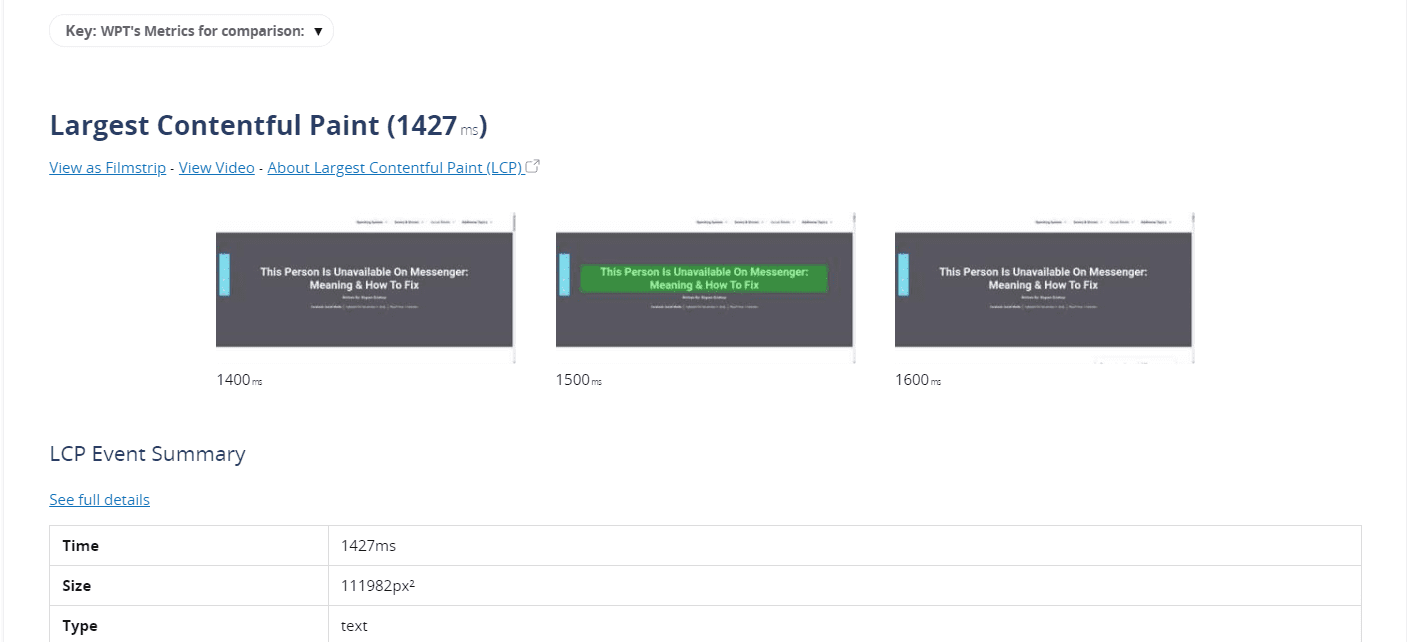
4. Test Your Page On Web Page Test
Webpagetest.org is a page performance testing tool that provides in-depth insights. When you scan a page for web vitals, this tool will give you the scores and elements responsible for LCP.
This is a handy tool to inspect layout shifting issues as well; you can see which element is responsible for the layout shifts on your pages, making it easier for you to fix it.
The web Page Test report will highlight the LCP elements with green and provide the timing.
Once you are aware of the reasons for LCP, you can proceed to optimize the LCP content to fix LCP issues on your page if any. Here are a couple of tips on fixing LCP issues.
Few Tips To Fix LCP Issues On Your Page:
1. Optimize your images: Make sure your images are lightweight while the quality is intact. I prefer to keep images between 50 – 100 Kb whenever possible, and it’s quite achievable if you are not running a photography website, portfolio website, or any sites where images are a priority.
2. Preload your logo: Preloading the logo does not add much to performance, but you would want to load your site logo as soon as possible. This usually gives a 2-5% of boost to LCP timing when done right.
3. Avoid using too many fonts: Fonts make a site attractive but loading too many font files will increase the asset load chain and may be responsible for the late printing of texts on a web page.
4. Localize and preload above-the-fold fonts: Although google fonts are fast, my favorite strategy that seems to work every time is localizing above-the-fold fonts and preloading them. While preloading, you need to be sure that these font files are not too heavy. In addition, your web server’s speed needs to be fast for localized font files to be served faster.
5. Optimize Javascripts: To optimize your JavaScripts remove unused codes, make sure the code is up to date and compatible with modern browsers, use modern JavaScript libraries and try reducing payloads. A caching plugin with javascript management options makes the job easier for you.
6. Optimize CSS codes: Compressing CSS files and implementing critical CSS often solve render-blocking issues related to CSS. Removing unused CSS files from your WordPress site can help scale down the LCP metric.
Relevant posts: